Thursday, October 27, 2011
Income Stats Fit For a Depression
Tax return data by income levels
First, let us gather a glimpse of actual household tax filing information:

Source: IRS
With all the discussion about the 99 percent I think you have many people that are largely off on what they assume is the one percent. The media is largely to blame and I have even seen business outlets interview people that claim to make $100,000 and are afraid of being taxed because they are in the one percent. Uh, not exactly.
Let us examine the data:
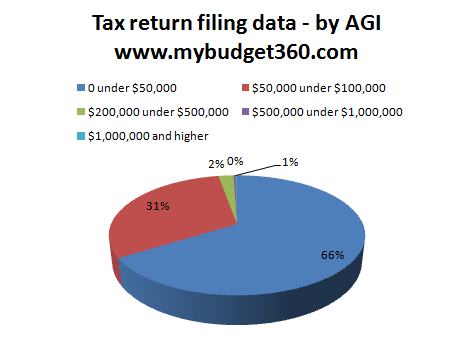
66 percent of tax returns show an adjusted gross income of $50,000 or lessSo with these two groups, you are covering 97 percent of all households. Now keep in mind we are looking at adjusted gross income so actual wages will be higher, but not by much.
31 percent of tax returns show an adjusted gross income between $50,000 and $100,000
“So what does it take to be in the top one percent? You will need an adjusted gross income of $1,000,000 or more.”Even folks with an AGI between $200,000 and $500,000 don’t fall in this category. Of course Wall Street investment bankers want to make people believe that even with a $100,000 household income that somehow if investment banks were regulated that they will lose their entire life savings (this is actually already happening with housing and the casino known as Wall Street).
Let us dig deeper into the tax data.
Tax returns broken down further

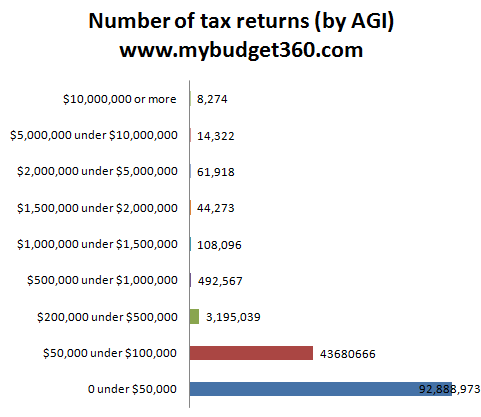
Out of roughly 140 million tax returns in the latest data, 92 million had AGI of less than $50,000. Couple this with Social Security data which is based on raw W2 income and we find that the typical American worker is pulling in $26,000 a year. Is this giving you a better perspective of wages in the United States?
It isn’t the case that those at the very top are increasing in number in a sizeable level, it is that the few at the top are getting wealthier and wealthier because of a:
-1. System favoring lobbying even if it is negative for the overall economy (which it is)This is unfortunately the way the system is tilted at the moment. You have high frequency trading that is all about making a quick buck on mini trends. What about charging a surcharge on every transaction? Let the hedge funds go wild but they will need to pay for it. The poor buy and hold investor stands no chances against these Wall Street gamblers.
-2. A system where Wall Street speculators pay less on their taxes than regular households
-3. A government for the banks and run by the banks
-4. A financial system focused on short term profits instead of long term sustainability
-5. A system that bails out the wealthy and forces the losses on the public
The burden of student loan debt
Hopefully this gives you a better perspective on the tax side of the equation. Contrary to how some big business shows portray the working class, 75 percent of total income tax is being paid by households making $500,000 or less. Of course the perception is that millionaire households are carrying the largest burden here which is not true.
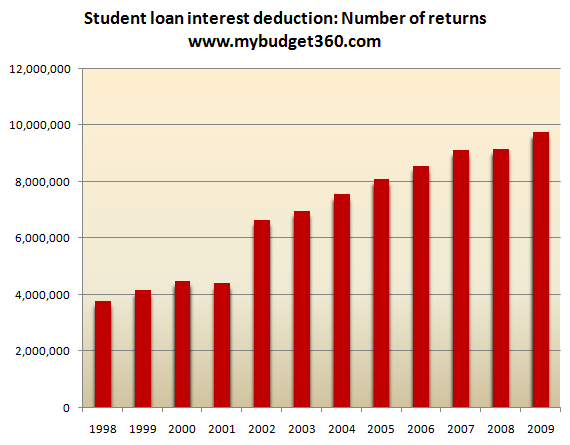
It is hard to get data on how many people are carrying student loan debt. I think I may have accidentally stumbled on a great measure for this. Since you can deduct student loan interest why not see how many people are claiming this on their tax returns?

Source: IRS
Now the above may understate the number of students in debt because it looks like one tax return may have two people claiming the deduction but only showing up as one (for one tax return). This is stunning data. In 2000 roughly 4,000,000 were claiming the student loan deduction. By 2009 this number was nearly 10,000,000! I’m sure once we get IRS data for 2010 we will see this figure surpass 10,000,000. This just highlights the fact that with rising education costs and declining household incomes, more and more Americans are simply financing their education. Why else would those claiming the student loan deduction surge nearly 150 percent in a decade?
The disappearing middle class
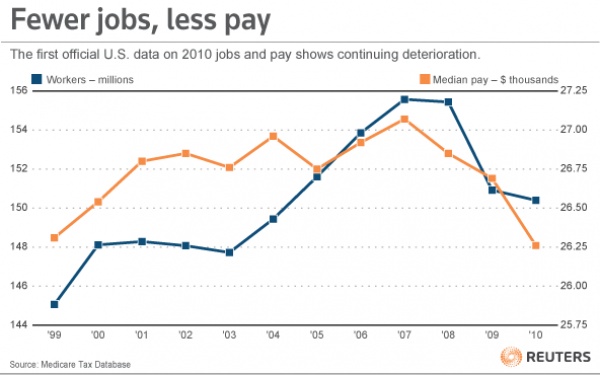
Another troubling data point was found in the Social Security data showing an entire decade of wiped out wage growth:

Source: Social Security, Reuters
Since the recession hit in 2007 actual pay has been decimated. The median per worker wage for Americans fell from roughly $27,000 in 2007 to $26,250 in 2010. This is in nominal terms so inflation is eating away even more and more at the middle class as the Federal Reserve continues to bail out the banking sector.
It is rather clear why the press doesn’t want to cover this. They want to keep people spending and believing in the financial system even though it is completely rigged. Why bring this up? Yet as we reach peak debt situations around the world we have tough decisions to make.
Subscribe to:
Post Comments (Atom)


No comments:
Post a Comment