
The Gold Report: John, at the recent Casey Research Recovery Reality Check conference you described the economic recovery heralded by the Obama administration as an illusion based largely on skewed inflation data. Can you walk us through why, based on your calculations, a recovery is impossible?
John Williams: We can start with the gross domestic product (GDP), which like most economic reports is adjusted for inflation. If you take inflation out of it, what is left should be changes in economic activity, as opposed to changes from prices going up or down.
Reported GDP activity for Q3/11, Q4/11 and Q1/12 was above where it had been going into the recession. Formally, that is a recovery. The problem is that no other major economic series shows that same pattern, which is a physical impossibility if the GDP numbers are accurate.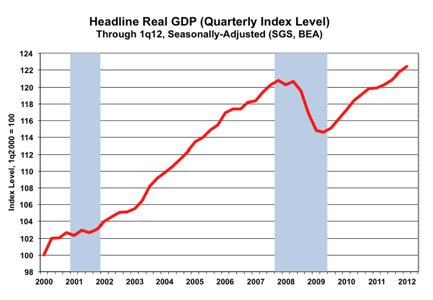
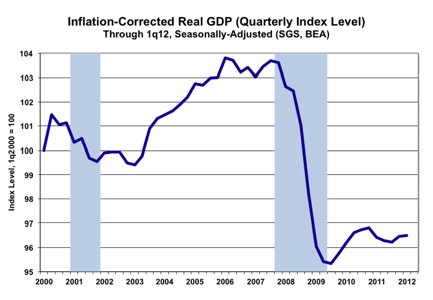
I contend that the recovery is an illusion created by the government using inflation numbers that are too low when deflating economic series. The lower the inflation rate you use for adjustment, the stronger the resulting inflation-adjusted growth.
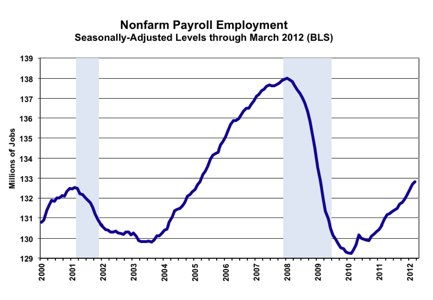
In addition, a number of reports such as payroll employment have no ties whatsoever to pricing or inflation. Payrolls have risen a little bit since the trough, but they just recently recovered the levels they hit before the 2001 recession, some 12 years ago. They have not come close to their pre-2007 highs.
TGR: Would you include the unemployment rate among those unreliable reports, given that it does not count people who have stopped looking for jobs or are underemployed?
JW: It is a matter of definition, but that is right as to the headline number at 8.1%. Looking at the number of people who consider themselves unemployed, there has been no real decline in the unemployment rate. It remains at a level not seen outside of the worst recessions.
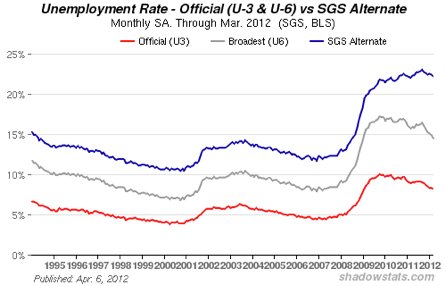
If you include people who are out of work and have given up looking for work, but consider themselves unemployed because they would take a job if one were available, the unemployment rate is something over 22%. Again, this is not a number tied to inflation.
TGR: You compared that to the Great Depression in your presentation.
JW: During the Great Depression, the estimated unemployment rate peaked in 1933 at 25%. But that included 27% of the population living and working on farms. Today, less than 2% of the population works on farms. A more meaningful comparison perhaps would be the non-farm unemployment rate, which in the 1930s peaked at about 35%. We are still shy of that.
TGR: Which is a more accurate indicator, the payroll employment rate or the GDP?
JW: The indicator here, in terms of payroll employment or the number of jobs, is well off its peak. There has been no employment growth in 10 years, despite 10% growth in the population. There is no recovery based on the employment data, which is a coincident indicator. That is a more accurate picture of what is happening in the economy than the rosy scenario coming out of the GDP estimates.
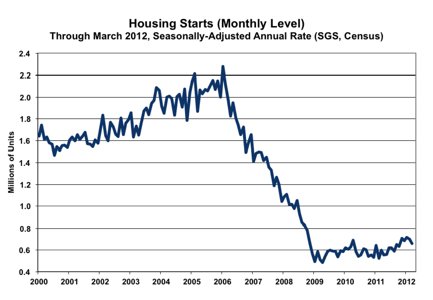
Another series that has no ties to inflation is housing starts. This is perhaps the hardest hit area of the economy. It peaked in 2006, has dropped about 75% and is bottom-bouncing. It is stagnant at a historically low level.
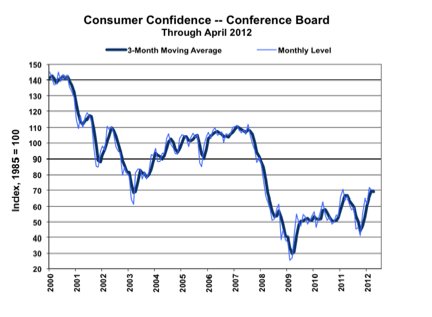
Consumer confidence is the same. It plunged and is bottom-bouncing.
TGR: Consumer liquidity is related to consumer confidence. There is a lack of positive, inflation-adjusted income growth. Your statistics show the real average weekly earnings for production for non-supervisory employees was down 0.6% from the first quarter of 2011. It peaked in 1973 and has been going downhill ever since. How important are real earnings and associated retail spending to a recovery?
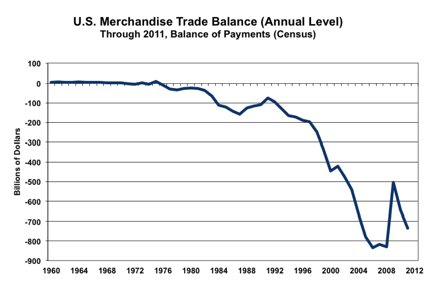
JW: They are quite important. We are not in recovery because consumers are in severe financial straits. There is a structural problem with income. We have lost a lot of jobs offshore—generally higher paying production jobs—due to our ever-expanding trade deficit.
Not only are average earnings down at an individual level, so is household income. In the 1970s, when earnings peaked, it was more common to have one person in the household working, usually the husband, with the wife at home raising the kids. As individuals saw their income drop off faster than inflation, many households needed to have two people working to make ends meet.
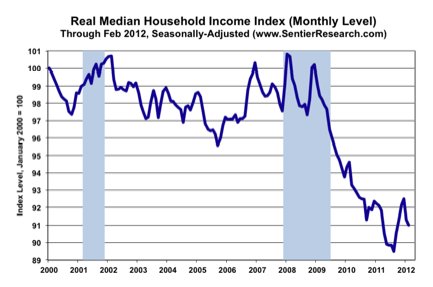
Adjusted for the government’s inflation measure, household income continues to shrink month after month. Without real growth in income—growth that’s faster than the pace of inflation—you can never have sustained, positive growth in consumption. You can buy short-term growth through debt expansion, but the key is sustainable growth.
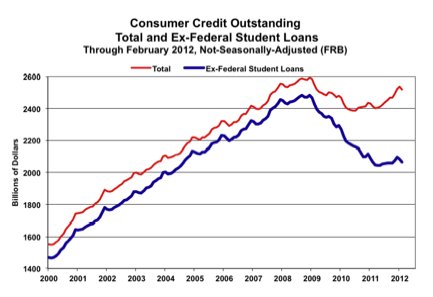
TGR: Student loans, which are up 29.9% from 2011, have been in the news lately. Are student loan burdens and their interest rates having a real impact on the economy or are they just an isolated piece?
JW: I think of student loans as one part of outstanding consumer credit. A lot of people looking at the system’s liquidity believe that consumer credit outstanding has almost reached its pre-recession high. That is due solely to the expansion of student loans.
Normal consumption lending—credit cards or fixed loans—has been dropping off and is bottom-bouncing. The extraordinary growth in student loans looks like a big problem going forward, a bubble like the mortgage market.
If you look at the overall bank lending, banks’ balance sheets are so impaired that they cannot lend normally. Everything considered, bank lending is flat.
TGR: Is our GDP structured such that domestic consumer spending is needed for a recovery?
JW: Consumer spending accounts for 71% of the GDP and everything else is pretty much related to it in some form or another.
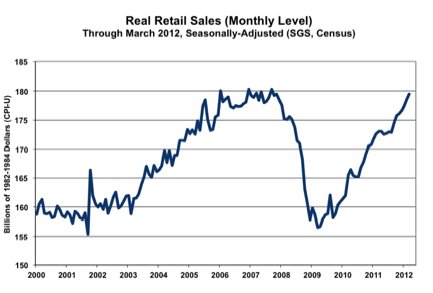
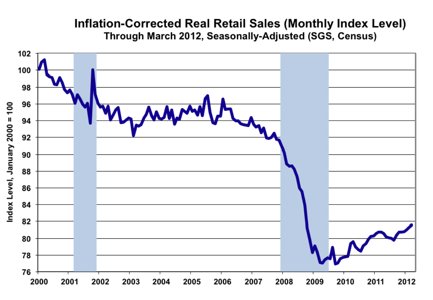
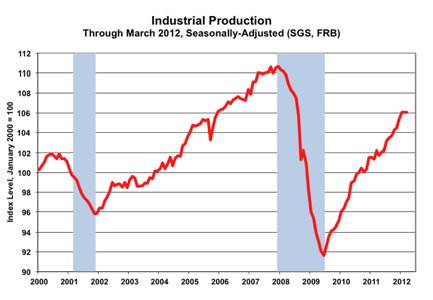
For example, look at retail sales. If you remove the artificially depressed inflation numbers imposed by the government, you see a pattern of plunging activity and bottom-bouncing. The same is true for industrial production.
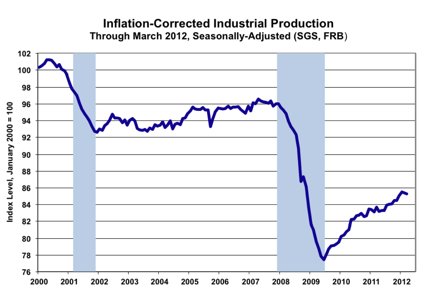
The liquidity problems are at a point now that consumers, both in terms of income and credit, have not been in a position to fuel a recovery. There is no recovery coming. That has all sorts of implications for the markets.
We had a financial panic and a near collapse in 2008. The people in Washington, D.C. had to prevent a collapse. The primary function of the Federal Reserve is to keep the banking system healthy, to keep it afloat. Taking care of the economy and containing inflation are secondary goals.
The federal government and the Fed created, spent, guaranteed or loaned whatever money was needed to keep the banking system alive, and the government will do that again. The problem is, that creates inflation and is not very effective. Yes, we avoided a systemic collapse, but the banking system is still in trouble four years later. The solvency crisis continues. The economy has not recovered. All they have done is kick the proverbial can down the road.
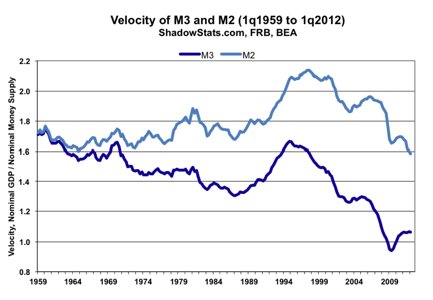
TGR: What do your money-velocity statistics show relative to the existence or absence of a recovery?
JW: I still track what used to be the broadest measure of the money supply, M3. There are three M measures. The M1, the smallest measure, includes cash, checking deposits, traveler’s checks and such. The M2 includes M1 plus savings accounts, small time deposits and retail money market funds. That is as far as the Fed goes today.
It used to have an M3 category, which included M2 plus substantial categories such as institutional money funds and large time deposits. The M3 is almost twice as big as the M2. The Fed stopped reporting M3, but I still track it.
A lot of people have noted the strong growth in M2 recently, but I believe that growth is out of context. That growth is due to funds flowing out of M3 accounts into M2 accounts. The broadest measure, M3, had some recent growth, but it is beginning to stagnate and turn down. That is a sign of stress in the system.
I put together a stress measure based on the ratio of M3 to M2. When the ratio is high, you generally have good confidence in the banking system. Big, uninsured funds are flowing into the banks.
At the crisis point in 2008, the ratio plunged. Immediately, the Fed introduced quantitative easing (QE). When that failed to bring the banks around, it introduced QE2. The ratio of M3 to M2 continues to worsen. I would expect we will see QE3 from the Fed in the not-too-distant future.
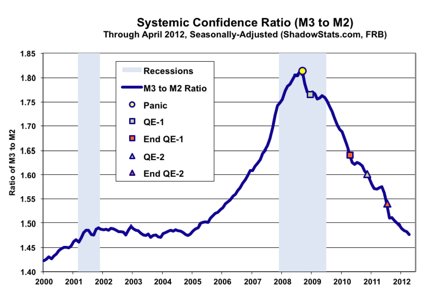
The Fed may call it something else, because QE3 will not play well politically to announce the infusion of a couple of trillion dollars into the banking system. The Fed will say it is necessary to stimulate a slowing economy.
This is a very dangerous situation, one that eventually will lead to a massive decline in the U.S. dollar. Global confidence has been lost in the dollar. I think the Fed’s next action will trigger renewed dollar selling, leading to dollar inflation, which is already starting to accelerate. Weakness in the dollar tends to spike oil prices, a big factor behind domestic inflation.
We have been having inflation in a weak economy. Instead of being driven by strong demand—which is a relatively happy circumstance for having inflation—inflation today has been created by a weak dollar and unstable monetary policy by the Fed. That is not a happy circumstance. It is a circumstance that promises much higher inflation as people look at preserving their assets.
TGR: The federal government has been reporting inflation between 2% to 3%. You just updated your 2012 hyperinflation report. What is real inflation right now?
JW: The government’s numbers are accurate by its definition, but they are not what people think they are. Over the years, the methodologies have changed.
The average person thinks that the Consumer Price Index (CPI) measures inflation, that it reflects the cost of maintaining a constant standard of living. They also believe that it reflects out-of-pocket inflation. It does not, nor does it reflect the cost of maintaining a constant standard of living.
After World War II, the CPI was used to measure the cost of inflation for a fixed basket of goods and services. For example the basket of goods might contain a gallon of gas, a pound of steak and a loaf of bread. The government would measure the same, year after year. However much the price had gone up, that was how much inflation had gone up.
In the 1990s, Fed Chairman Alan Greenspan and Michael Boskin, then chairman of the Council of Economic Advisors, started pushing the story that the CPI was overstating inflation. They figured that adjusting the CPI reporting would reduce the Social Security cost-of-living adjustments. That is why they did it. If they had not changed the CPI, Social Security checks would be about double what they are today.
But at the same time, they introduced a substitution that made the CPI worthless for anyone trying to use it as a target for calculating, for example, what their minimum return on investment should be in order to maintain their standard of living.
If you use an inflation rate that is too low, you get a too-strong inflation growth. You see recovery that is not there, which is what we’ve been seeing.
Other changes have been made beyond the CPI substitution. Usually, when the government changed its methodology, it published an estimate of the change’s effect on inflation. If you add all of those changes together, you find that, since 1980, about five percentage points have been taken away from the annual inflation rate. Another two percentage points can be attributed to changes the government did not consider methodological and therefore did not estimate the effect, but they are very much a factor.
So, seven percentage points have been taken out of the CPI. If inflation is being reported at 2.5%, adding that 7% back in puts inflation up around 9.5 to 10% using the 1980 CPI methodology. Using the 1990 methodology, it would be 6% to 7%. That is what people need to be making to stay ahead of inflation.
TGR: What can individuals do to protect themselves if the hyperinflation you are predicting comes to pass?
JW: We keep moving down the road to hyperinflation. This is not the time to worry about short-term gains or losses in the marketplace. It is the time to make sure your basic wealth and assets are protected against inflation, and that you are in a position to ride out a bad financial storm ahead.
TGR: How do you do that?
JW: Your primary hedge is physical gold; precious metals, including silver; and some assets outside the dollar. I still like the Swiss franc—its ties to the euro will not last. I like the Australian dollar and the Canadian dollar. Having funds actually outside the U.S. is a plus. To get through the crisis, you need a hard asset that is liquid for the near term.
Over the longer haul, gold stocks are wonderful hedges, but if the system gets into real trouble, which I think it will, you may have liquidity issues in the market. I am talking about limitations on the physical ability to transact in the market. You may also have liquidity problems with real estate, although over time, real estate is a tremendous hedge against inflation.
TGR: What is the best investment advice you ever received?
JW: Well, I do not generally take investment advice, but the best investment advice I ever gave myself was to buy gold.
TGR: Advice our readers will appreciate. John, thank you for your time.
Walter J. “John” Williams has been a private consulting economist and a specialist in government economic reporting for 30 years. His economic consultancy is called Shadow Government Statistics. His early work in economic reporting led to front-page stories in The New York Times and Investor’s Business Daily. He received a bachelor’s degree in economics, cum laude, from Dartmouth College in 1971, and was awarded a Master of Business Administration from Dartmouth’s Amos Tuck School of Business Administration in 1972, where he was named an Edward Tuck Scholar.
Williams went into much more detail about the economic troubles he foresees for America during his presentation at the recent Casey Research Recovery Reality Check Summit. You can hear it in its entirety, as well as every recorded summit presentation with the Summit Audio Collection. It contains over 20 hours of recordings and features contrarian investing legend Doug Casey, Porter Stansberry of “End of America” fame, former director of the US Office of Management and Budget David Stockman, and Thoughts from the Frontline Editor John Mauldin. All together, 31 of the greatest financial minds of our time were on hand to share their views of the economy and offer actionable investment advice, including specific stock picks, to protect you in these troubling times.


No comments:
Post a Comment